May 2026 in Los Gatos: More single-family homes sold, and the median rose with them
# May 2026 in Los Gatos: More single-family homes sold, and the median rose with them
Fifty-six closings. A median sale price of $2,610,500. But before you read anything into that number, you need to know how it got there — because this month, what sold mattered as much as what it sold for.
The numbers
| Metric | May 2026 |
|---|---|
| Closings | 56 |
| Median sale price | $2,610,500 |
| Median price per sq ft | $1,238 |
| Median days on market | 16 |
| Sale-to-list ratio (median) | 100% |
| Sold over list | 24 |
| Sold under list | 26 |
| Sold at list | 6 |
What sold
Single-family homes dominated the month in a way that shapes every headline figure. Forty-six of the 56 closings were detached houses — 82% of the market — ranging from $710,000 to $6,750,000. Their median landed at $3,189,650, with a median of $1,308 per square foot and 16 days on market. That's a deep, active segment with enough volume to read clearly.
Townhouses were a different story. Seven sold, ranging from $1,245,000 to $2,000,000. That's not enough to report a median responsibly, so the range is what you get: the floor was just above $1.2M, the ceiling exactly $2M.
Condominiums: three sales, $495,000 to $2,125,000. A wide spread across a tiny sample. No median here either — just note that the low end of this segment reaches places the rest of Los Gatos doesn't.
What moved the median
This has to be said plainly: the overall median of $2,610,500 is not a clean picture of what prices did in May. The mix shifted enough to move it on its own.
Single-family homes made up 82% of May closings. The previous month, they were 71% — an 11-point jump. When the most expensive segment of any market suddenly accounts for a larger share of everything that closed, the blended median goes up even if not a single home sold for more than it would have the month before. That's what happened here. The overall figure reflects who showed up to the table, not necessarily a change in what any given home is worth.
The segment-level numbers — $3,189,650 for single-family, and whatever the townhouse and condo ranges tell you — are where to look if you want to understand pricing within a type. The overall median is still a fact. It just needs this context to mean anything.
On the competitive front, May split almost evenly: 24 homes sold over list, 26 under, and the median sale-to-list ratio landed exactly at 100%. That's a genuinely balanced result. There was no collective pressure in either direction — some sellers gave ground, some buyers did, and the median held at asking. Sixteen days was the median time to contract, which is enough time for most buyers to get a second look but not so long that anything is sitting.
The one to notice
The month's biggest overbid wasn't on a teardown or an obvious flip target. 16528 Marchmont Drive listed at $2,999,888 and closed at $3,600,000 — 20% over asking, a gap of $600,112. Eight offers? Twelve? The record doesn't say. What it says is that someone — or more likely multiple someones — looked at that list price and decided it wasn't close to what the house was worth to them. A 20% overbid in a month where the median sale-to-list was exactly 100% is not a market trend. It's a specific house, a specific day, a specific competition. But it's also a reminder that "the market" is an average of a lot of very individual decisions, and sometimes one of them is: I'm not losing this one.
On the other end of the spectrum, 14990 Winchester Boulevard came in at $4,000,000 after listing at $4,487,000 — a reduction of nearly $487,000, or 10.9%. And the month's top sale, 115 Glenridge Avenue, closed at $6,750,000 in 8 days on 4,089 square feet. Quick, clean, and at the very top of everything that traded in Los Gatos in May.
Every recorded sale this month
All 56 closings, in order of price. Each address links to its full record.
| Address | Type | Bd/Ba | Sq ft | List | Sold | % of list | DOM | Closed |
|---|---|---|---|---|---|---|---|---|
| 115 Glenridge Avenue | Single Family | 6/4 | 4,089 | $5,998,000 | $6,750,000 | 112.5% | 8 | May 12 |
| 227 Alexander Avenue | Single Family | 4/3 | 3,585 | $5,700,000 | $6,250,000 | 109.6% | 3 | May 28 |
| 16250 Brooke Acres Drive | Single Family | 4/3.5 | 4,207 | $5,500,000 | $5,500,000 | 100.0% | 0 | May 1 |
| 19650 Sky Oaks Way | Single Family | 5/2.5 | 3,245 | $4,500,000 | $4,850,000 | 107.8% | 8 | May 26 |
| 135 Hill Top Drive | Single Family | 4/5.5 | 4,165 | $5,200,000 | $4,750,000 | 91.3% | 36 | May 28 |
| 86 Central Avenue | Single Family | 5/4.5 | 3,912 | $4,798,000 | $4,600,000 | 95.9% | 27 | May 7 |
| 203 Alexander Avenue | Single Family | 5/4 | 2,422 | $3,995,000 | $4,425,000 | 110.8% | 24 | May 11 |
| 102 Palo Colorado Drive | Single Family | 5/4.5 | 3,368 | $3,995,000 | $4,410,000 | 110.4% | 5 | May 22 |
| 18400 Lakeview Court | Single Family | 6/5 | 7,188 | $4,600,000 | $4,315,000 | 93.8% | 39 | May 13 |
| 125 Via Santa Maria | Single Family | 4/2.5 | 2,505 | $3,798,000 | $4,250,000 | 111.9% | 0 | May 22 |
| 16344 Camellia Terrace | Single Family | 4/2.5 | 2,303 | $3,950,000 | $4,250,000 | 107.6% | 3 | May 29 |
| 285 Marchmont Drive | Single Family | 4/2.5 | 2,577 | $4,199,000 | $4,100,000 | 97.6% | 9 | May 13 |
| 14990 Winchester Boulevard | Single Family | 4/4 | 3,201 | $4,487,000 | $4,000,000 | 89.1% | 23 | May 19 |
| 120 Brocastle Way | Single Family | 4/2.5 | 2,834 | $3,998,000 | $3,975,000 | 99.4% | 39 | May 19 |
| 727 Bicknell Road | Single Family | 5/3.5 | 3,789 | $3,898,000 | $3,800,000 | 97.5% | 36 | May 6 |
| 270 Belvue Drive | Single Family | 4/2.5 | 3,171 | $3,549,000 | $3,650,000 | 102.8% | 0 | May 5 |
| 16897 Mitchell Avenue | Single Family | 4/4.5 | 3,485 | $3,698,000 | $3,650,000 | 98.7% | 53 | May 26 |
| 16528 Marchmont Drive | Single Family | 3/1.5 | 1,196 | $2,999,888 | $3,600,000 | 120.0% | 0 | May 15 |
| 105 Calle El Padre | Single Family | 4/3 | 2,611 | $3,100,000 | $3,500,000 | 112.9% | 7 | May 14 |
| 16346 Oleander Avenue | Single Family | 3/2.5 | 2,129 | $3,500,000 | $3,500,000 | 100.0% | 4 | May 22 |
| 272 Belblossom Way | Single Family | 6/3.5 | 3,167 | $3,495,000 | $3,375,000 | 96.6% | 22 | May 27 |
| 215 Vista De Sierra | Single Family | 5/3 | 2,788 | $3,250,000 | $3,250,000 | 100.0% | 33 | May 29 |
| 16839 Frank Avenue | Single Family | 3/2 | 2,269 | $3,298,000 | $3,229,300 | 97.9% | 28 | May 27 |
| 139 Belvue Drive | Single Family | 6/3 | 2,448 | $3,098,000 | $3,150,000 | 101.7% | 18 | May 27 |
| 16231 Azalea Way | Single Family | 3/2 | 1,615 | $2,879,000 | $3,125,000 | 108.5% | 4 | May 22 |
| 40 Pleasant Street | Single Family | 3/2 | 1,808 | $3,149,000 | $3,120,000 | 99.1% | 23 | May 11 |
| 183 Belvue Drive | Single Family | 4/2 | 1,843 | $2,988,000 | $2,900,000 | 97.1% | 13 | May 14 |
| 939 Cherrystone Drive | Single Family | 3/2 | 1,735 | $2,698,000 | $2,801,000 | 103.8% | 11 | May 1 |
| 52 Jackson Street | Single Family | 3/3 | 1,720 | $2,498,000 | $2,420,000 | 96.9% | 32 | May 13 |
| 124 & 126 Camellia Terrace | Single Family | 5/3 | 1,985 | $2,398,000 | $2,410,000 | 100.5% | 10 | May 11 |
| 16970 Placer Oaks Road | Single Family | 5/3 | 2,235 | $2,400,000 | $2,385,000 | 99.4% | 13 | May 18 |
| 1620 Elwood Drive | Single Family | 3/2.5 | 1,766 | $2,250,000 | $2,300,000 | 102.2% | 8 | May 20 |
| 15534 Linda Avenue | Single Family | 2/2 | 1,118 | $1,998,999 | $2,152,000 | 107.7% | 13 | May 29 |
| 15590 Linda Avenue | Single Family | 2/1 | 977 | $1,799,999 | $2,150,000 | 119.4% | 13 | May 14 |
| 219 Prince Street | Single Family | 3/2 | 1,456 | $2,100,000 | $2,130,000 | 101.4% | 11 | May 27 |
| 127 Puesta Del Sol | Condominium | 3/2.5 | 2,160 | $2,075,000 | $2,125,000 | 102.4% | 24 | May 22 |
| 21420 Bear Creek Road | Single Family | 5/3 | 3,317 | $2,050,000 | $2,050,000 | 100.0% | 0 | May 4 |
| 27200 Loma Prieta Way | Single Family | 3/3 | 1,967 | $2,198,000 | $2,025,000 | 92.1% | 91 | May 5 |
| 172 Maricopa Drive | Single Family | 4/2 | 1,453 | $2,195,000 | $2,000,000 | 91.1% | 55 | May 14 |
| 142 Calle Larga | Townhouse | 3/3 | 2,035 | $1,888,000 | $2,000,000 | 105.9% | 3 | May 13 |
| 19930 Gist Road | Single Family | 3/2 | 1,991 | $1,749,000 | $1,700,000 | 97.2% | 3 | May 21 |
| 105 Almond Hill Court | Townhouse | 4/2.5 | 1,734 | $1,598,000 | $1,650,000 | 103.3% | 1 | May 11 |
| 12351 Indian Rock Way | Single Family | 3/2.5 | 2,623 | $1,648,000 | $1,625,000 | 98.6% | 43 | May 15 |
| 23535 Treeview Trail | Single Family | 3/2 | 2,660 | $1,600,000 | $1,600,000 | 100.0% | 21 | May 1 |
| 223 Casitas Bulevar | Townhouse | 1/2 | 1,347 | $1,548,000 | $1,492,500 | 96.4% | 14 | May 14 |
| 120 Carlton Avenue #51 | Townhouse | 3/2.5 | 1,604 | $1,498,000 | $1,465,000 | 97.8% | 20 | May 18 |
| 247 Casitas Bulevar | Townhouse | 2/2 | 1,268 | $1,450,000 | $1,450,000 | 100.0% | 7 | May 1 |
| 17060 Lon Road | Single Family | 4/2.5 | 2,114 | $1,499,999 | $1,440,000 | 96.0% | 39 | May 4 |
| 227 Casitas Bulevar | Townhouse | 2/2.5 | 1,463 | $1,399,000 | $1,425,000 | 101.9% | 47 | May 5 |
| 310 Tait Avenue | Single Family | 1/1 | 764 | $1,295,000 | $1,400,000 | 108.1% | 88 | May 5 |
| 127 Milmar Way | Townhouse | 2/2 | 1,015 | $1,198,000 | $1,245,000 | 103.9% | 6 | May 4 |
| 25435 Hutchinson Road | Single Family | 4/3 | 2,270 | $1,222,000 | $1,170,000 | 95.7% | 47 | May 20 |
| 17121 Laurel Rd | Single Family | 4/3 | 2,960 | $1,200,000 | $1,125,000 | 93.8% | 23 | May 4 |
| 17741 Comanche Trl | Single Family | 1/1 | 549 | $769,000 | $710,000 | 92.3% | 64 | May 12 |
| 576 W Parr Avenue #1 | Condominium | 2/1 | 934 | $575,000 | $530,000 | 92.2% | 35 | May 13 |
| 420 Alberto Way #5 | Condominium | 1/1 | 789 | $525,000 | $495,000 | 94.3% | 162 | May 13 |
Source: MLSListings closed sales in Los Gatos, May 2026. 56 closings. Sale prices and closing dates are matters of public record. A summary of recorded sales is not an appraisal and is not an opinion of value on any specific home.
Tim McMullen · DRE #02016832 · How these numbers are put together
More from Los Gatos
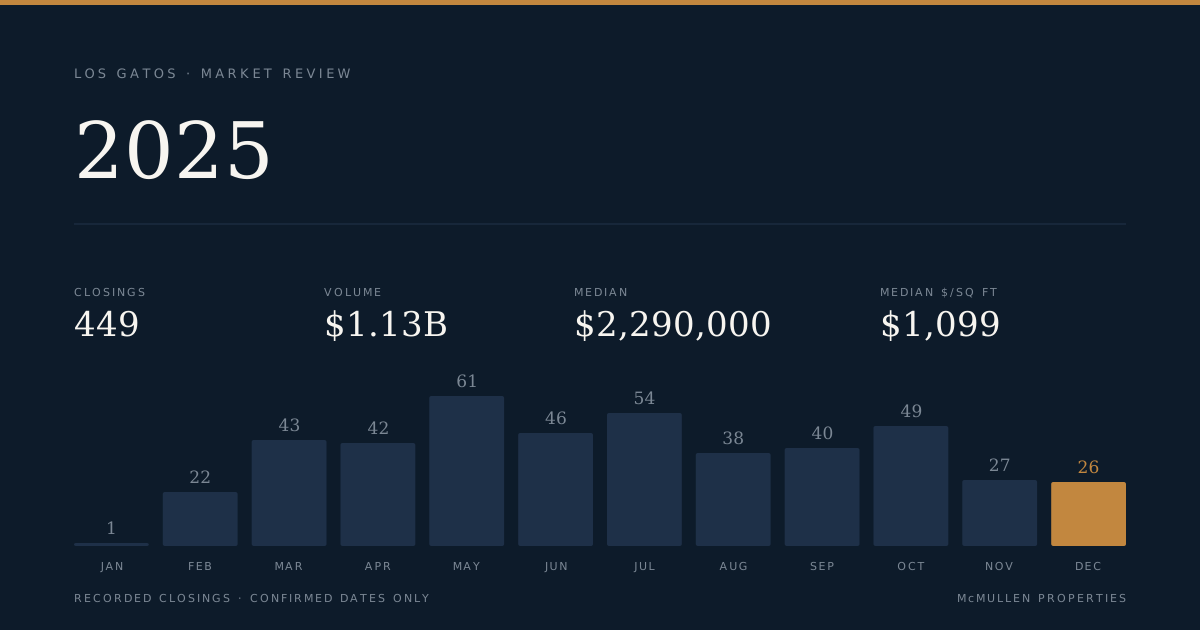
449 Closings, $1.13 Billion: Los Gatos 2025 by the Numbers
The full-year record covers 449 closed transactions across single-family, townhouse, and condominium segments, with a market-wide median of $2,290,000 and total volume of $1,129,374,552. The sharpest divide of the year ran not between segments but between price bands: the $2M–$3M band logged 101 closings while the top tier above $5M managed just 25, yet that upper tier posted the highest median price-per-square-foot of any band at $1,484.
343 acres sold in Los Gatos for $13 million — at $37,880 per acre
The sale of 25373 Spanish Ranch Road recorded as a land transaction, not a house sale. At 343.19 acres and $13 million, price per acre is the only unit that makes sense.
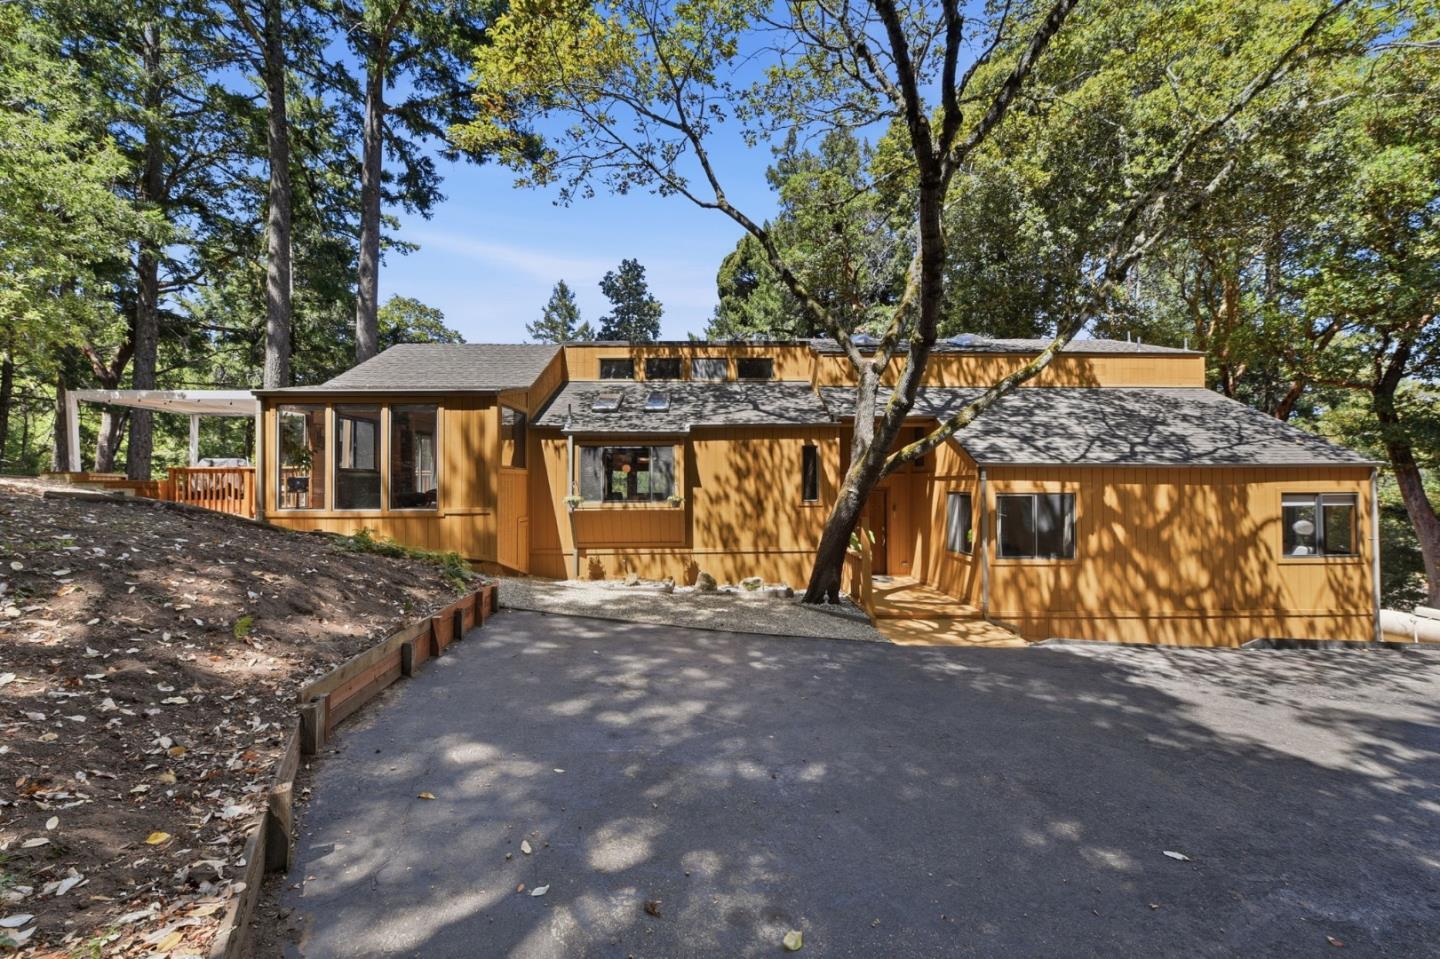
Back on the market 7 months after it last sold, at $98,000 more
22163 Miller Ridge Road recorded as sold in February 2026 for $1,400,000. It hit the active market again in August at $1,498,000 — a $98,000 spread in under seven months.