Los Gatos Q3 2026: 77 Closings, $193M in Volume, and a Per-Square-Foot Spread That Ran from $580 to $2,828
The period at a glance
| Metric | Q3 2026 |
|---|---|
| Total closings | 77 |
| Total volume | $193,035,456 |
| Median sale price | $2,175,000 |
| Median price per sq ft | $1,034 |
| Median square footage | 2,066 |
| Median lot size | 9,026 sq ft |
| Price range | $440,000 – $6,800,000 |
| Median DOM (of 21 reported) | 15 days |
Note: list-price data is available for this period but vs-asking figures were not reported in the underlying dataset, so no over-asking analysis appears below. Days on market was recorded for 21 of 77 closings; figures are cited where they appear but are not treated as representative of the full quarter.
Seventy-seven closings across three property types produced $193 million in gross volume for the quarter. The overall median of $2,175,000 sits comfortably inside single-family territory but is pulled down by eight townhouse and five condominium closings at the lower end of the range. Strip those out and the single-family median rises to $2,700,000 on 64 transactions—a segment that alone accounted for the bulk of volume and every sale above $2 million in the roster.
The quarter's spread is its most telling feature. The $440,000 floor (a condominium) and the $6,800,000 ceiling (130 Longmeadow Drive) are separated by $6.36 million—roughly 15 times the low. Per-square-foot figures tell the same story in sharper relief: the overall median of $1,034 masks a range that bottomed near $580 in the sub-$1M band and touched $2,828 on a single in-town small-footprint sale. Los Gatos does not trade as one market; it trades as several markets that happen to share a ZIP code.
The sales
The table below shows the top 40 closings by price. The full quarter had 77 closings.
| Address | Seg | Beds | Sq Ft | $/SF | Closed | DOM | Price |
|---|---|---|---|---|---|---|---|
| 130 Longmeadow Drive | SF | 5 | 3,892 | $1,747 | Aug 28 | — | $6,800,000 |
| 5770 Harwood Place | SF | 5 | 8,731 | $733 | Sep 3 | — | $6,400,000 |
| 16070 Matilija Drive | SF | 5 | 3,050 | $2,049 | Jul 27 | 7 | $6,250,000 |
| 14942 Larga Vista Drive | SF | 4 | 2,830 | $2,208 | Aug 20 | — | $6,250,000 |
| 16371 Aztec Ridge Drive | SF | 5 | 5,484 | $1,094 | Jul 13 | — | $6,000,000 |
| 18000 Overlook Road | SF | 7 | 6,193 | $868 | Aug 27 | — | $5,375,000 |
| 16970 Cypress Way | SF | 5 | 2,616 | $1,797 | Aug 28 | — | $4,700,000 |
| 52 Hernandez Avenue | SF | 4 | 4,015 | $1,083 | Sep 22 | — | $4,350,000 |
| 202 Granada Way | SF | 4 | 3,060 | $1,405 | Sep 17 | — | $4,300,000 |
| 124 Massol Avenue | SF | 5 | 3,015 | $1,327 | Sep 30 | — | $4,000,000 |
| 211 Glen Ridge Avenue | SF | 5 | 2,640 | $1,515 | Aug 20 | — | $4,000,000 |
| 120 Oak Meadow Drive | SF | 4 | 4,080 | $965 | Sep 30 | — | $3,938,000 |
| 156 Massol Avenue | SF | 5 | 2,861 | $1,274 | Jul 12 | — | $3,645,000 |
| 242 Howes Drive | SF | 4 | 2,003 | $1,685 | Sep 23 | — | $3,375,000 |
| 152 Via De Tesoros | SF | 5 | 2,701 | $1,214 | Sep 18 | — | $3,278,000 |
| 15850 Orange Blossom Lane | SF | 3 | 2,520 | $1,290 | Aug 26 | — | $3,250,000 |
| 16381 Roseleaf Court | SF | 4 | 1,933 | $1,562 | Sep 14 | — | $3,200,000 |
| 19601 Canon Drive | SF | 4 | 1,933 | $1,604 | Aug 6 | 125 | $3,100,000 |
| 402 Bella Vista | SF | 3 | 1,711 | $1,812 | Jul 27 | 5 | $3,100,000 |
| 16912 Kennedy Road | SF | 3 | 1,757 | $1,764 | Sep 18 | — | $3,100,000 |
| 193 Bacigalupi Drive | SF | 4 | 2,578 | $1,163 | Aug 31 | — | $2,999,000 |
| 212 Dover Street | SF | 4 | 2,276 | $1,296 | Sep 23 | — | $2,950,000 |
| 18300 Lakeview Court | SF | 5 | 3,640 | $810 | Jul 23 | 9 | $2,950,000 |
| 16375 W La Chiquita Avenue | SF | 3 | 1,043 | $2,828 | Jul 22 | 7 | $2,950,000 |
| 845 Pollard Road | SF | 4 | 2,130 | $1,362 | Aug 3 | — | $2,900,000 |
| 18355 Idylwild Road | SF | 4 | 3,718 | $767 | Aug 19 | — | $2,850,000 |
| 245 Los Gatos Boulevard | SF | 3 | 1,748 | $1,630 | Sep 15 | — | $2,850,000 |
| 116 Meadowbrook Drive | SF | 3 | 1,861 | $1,518 | Aug 25 | — | $2,825,000 |
| 16359 Shady View Lane | SF | 3 | 1,285 | $2,179 | Sep 15 | — | $2,800,000 |
| 136 Loma Alta Avenue | SF | 3 | 2,100 | $1,310 | Jul 15 | 100 | $2,750,000 |
| 42 Broadway | SF | 3 | 1,392 | $1,940 | Aug 11 | — | $2,700,000 |
| 15905 Orange Blossom Lane | SF | 5 | 2,327 | $1,160 | Jul 29 | 25 | $2,700,000 |
| 135 Belcrest Drive | SF | 3 | 2,241 | $1,205 | Jul 27 | 31 | $2,700,000 |
| 23457 Summit Road | SF | 5 | 3,417 | $746 | Sep 21 | — | $2,550,000 |
| 105 Loma Alta Avenue | SF | 3 | 1,578 | $1,616 | Sep 24 | — | $2,550,000 |
| 134 Lu Ray Drive | SF | 4 | 1,805 | $1,330 | Sep 23 | — | $2,400,000 |
| 200 Danville Drive | SF | 3 | 2,056 | $1,107 | Sep 3 | — | $2,275,000 |
| 119 Green Hill Way | SF | 3 | 1,646 | $1,337 | Sep 25 | — | $2,200,000 |
| 338 Creekside Village Drive | SF | 4 | 1,804 | $1,206 | Jul 31 | 2 | $2,175,000 |
| 315 Blossom Valley Drive | SF | 3 | 1,848 | $1,153 | Sep 30 | — | $2,130,000 |
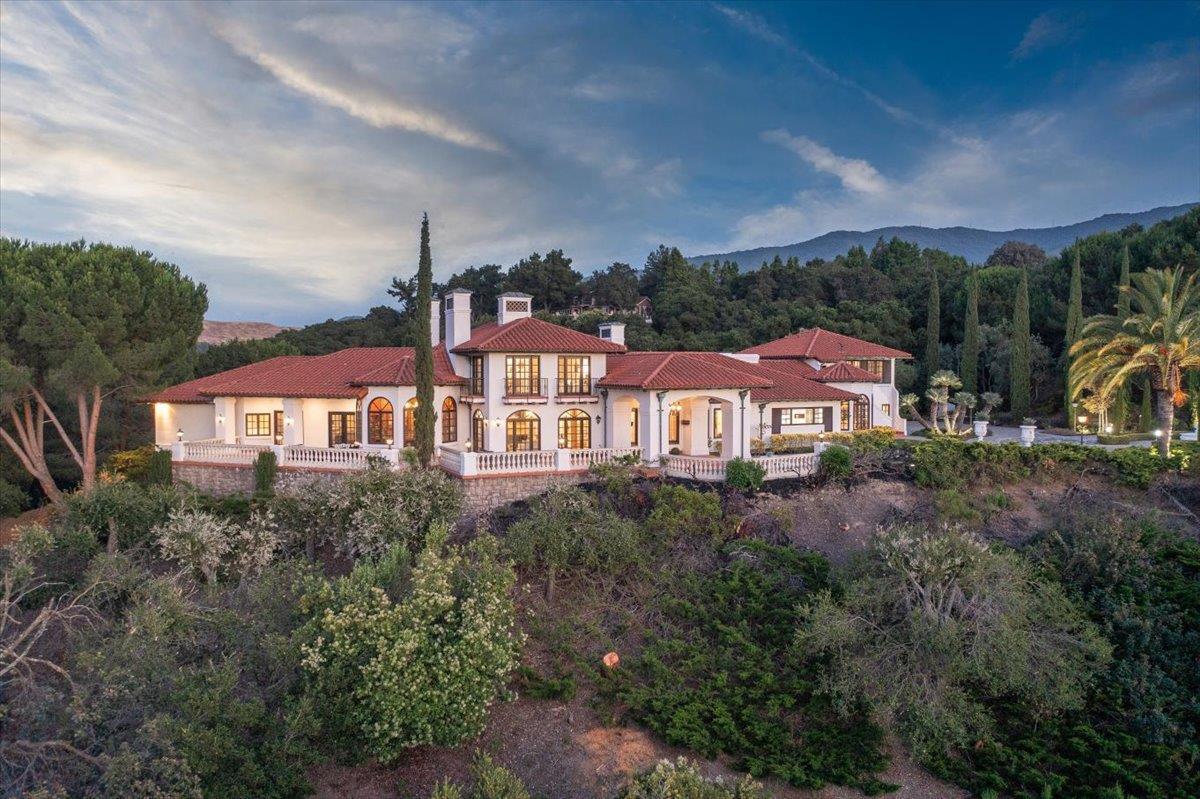
Four transactions stand out as anchors for the quarter.
130 Longmeadow Drive — $6,800,000. The quarter's highest closing was a 1957-vintage single-family home at 3,892 square feet on a 13,000-square-foot lot, yielding $1,747 per square foot. No DOM was recorded for this transaction.
16375 W La Chiquita Avenue — $2,950,000 in 7 days. A 3-bedroom, 1,043-square-foot single-family home that closed at $2,828 per square foot—the highest rate in the entire roster and one that inverts any intuition that larger homes command a premium on a per-foot basis. The lot size was not reported.
5770 Harwood Place — $6,400,000. At 8,731 square feet on nearly 4.4 acres, this was the quarter's largest home and second-highest price, yet it fetched just $733 per square foot—the lowest rate among the top six by price. Scale and setting do not automatically translate to per-foot efficiency in the Los Gatos hills.
19601 Canon Drive — $3,100,000 after 125 days. The longest reported marketing period of the quarter ended at $3.1 million for a 4-bedroom, 1,933-square-foot home. No year built was recorded. It closed the same month as 402 Bella Vista, a 3-bedroom, 1,711-square-foot home that reached the same $3,100,000 price in 5 days.
Where the market split
By segment
| Segment | Closings | Median Price | Median $/SF | Median Sq Ft | Range |
|---|---|---|---|---|---|
| Single Family | 64 | $2,700,000 | $1,156 | 2,259 sq ft | $710K – $6.8M |
| Townhouse | 8 | $1,514,000 | $897 | 1,520 sq ft | $1.14M – $1.8M |
| Condominium | 5 | $540,000 | $593 | 1,054 sq ft | $440K – $1.575M |
Single-family homes dominated the quarter with 64 of 77 closings—83 percent of transactions and the overwhelming share of dollar volume. The median single-family price of $2,700,000 is nearly 1.8 times the townhouse median of $1,514,000, and roughly five times the condominium median of $540,000. The condominium segment, with only five closings, does not support a median reading as a trend; the range of $440,000 to $1,575,000 shows meaningful spread within a thin sample.
The townhouse segment (8 closings) occupied a tighter band, with all eight transactions falling between $1.14M and $1.8M. Its median per-square-foot figure of $897 sits well below the single-family median of $1,156—a gap of roughly 22 percent—which in part reflects the townhouse segment's smaller median footprint (1,520 sq ft versus 2,259 sq ft for single-family).
By price band
| Band | Closings | Median $/SF |
|---|---|---|
| Under $1M | 8 | $580 |
| $1M – $1.5M | 11 | $596 |
| $1.5M – $2M | 13 | $846 |
| $2M – $3M | 25 | $1,206 |
| $3M – $5M | 14 | $1,460 |
| $5M and up | 6 | $1,421 |
The price-band table contains what may be the quarter's most interesting data point: the $5M-and-up band's median per-square-foot figure of $1,421 is slightly below the $3M–$5M band's $1,460. The six closings at $5M and above included two very large homes—5770 Harwood Place at 8,731 square feet and 16371 Aztec Ridge Drive at 5,484 square feet—whose size depresses the per-foot median even as their absolute prices lead the quarter. The $3M–$5M band, by contrast, skewed toward more compact homes trading at high per-foot rates.
The $2M–$3M band was the quarter's most active, accounting for 25 of 77 closings—nearly a third of all transactions. The jump in median per-square-foot from $846 in the $1.5M–$2M band to $1,206 in the $2M–$3M band (a 43 percent increase) marks the most significant inflection point in the table and roughly corresponds to the transition from townhouse and entry-level single-family product into in-town single-family homes.
The combined sub-$1.5M bands (19 closings, median $/SF $580–$596) represent the condominium, some townhouse, and the lower end of single-family product. Their per-foot figures are compressed relative to the rest of the market, reflecting both property type and location within the broader Los Gatos geography.
Across the quarter
| Month | Closings | Median Price | Median $/SF |
|---|---|---|---|
| July 2026 | 16 | $2,700,000 | $1,127 |
| August 2026 | 27 | $2,000,000 | $868 |
| September 2026 | 34 | $2,165,000 | $1,095 |
The quarter closed more transactions each successive month—16, then 27, then 34—but the median price and per-foot figures did not follow the same direction. July's 16 closings posted the highest median price ($2,700,000) and highest median per-square-foot ($1,127). August's 27 closings pulled both figures down: the median price fell to $2,000,000 and the median per-foot figure to $868. September's 34 closings partially recovered on both measures, reaching $2,165,000 and $1,095 per square foot.
The August dip is consistent with a month-mix effect as much as any directional shift. August's roster included several large-footprint hillside properties—18355 Idylwild Road (3,718 sq ft, $767/SF), 18300 Lakeview Court (3,640 sq ft, $810/SF)—that compress per-foot medians without indicating a change in underlying transaction character. July's 16 closings included the $6,250,000 Matilija Drive transaction (7-day DOM, $2,049/SF) and the $2,950,000 La Chiquita transaction ($2,828/SF), both of which elevated the month's per-foot median. With closings at 16 in July, the median rests on a small base and individual transactions move it materially.
September's recovery to $2,165,000 and $1,095/SF on 34 closings represents the quarter's most statistically grounded monthly read, though the $535,000 gap between September's median and July's reflects genuine mix differences between the months rather than a simple directional move.
What it means
For sellers
Sixty-four single-family closings over three months at a median of $2,700,000 represents an active quarter for Los Gatos. The $3M–$5M band (14 closings, median $1,460/SF) was more active than the $5M-and-up tier (6 closings), and the per-foot premium did not automatically follow price upward beyond $5M. Sellers of large-footprint hillside properties saw lower per-foot returns than sellers of compact in-town homes—a pattern visible across multiple paired transactions in the roster. The two homes that spent the most time on market (125 days at Canon Drive, 100 days at Loma Alta Avenue) both closed; extended marketing periods did not prevent a transaction, but they are the exception in a quarter where the median DOM, among the 21 closings that reported it, was 15 days.
For buyers
The full price range ran from $440,000 (condominium) to $6,800,000 (single-family), and the $2M–$3M band alone absorbed 25 closings—the most active single tier. The townhouse segment (8 closings, $1.14M–$1.8M) offered the most defined band with the least dispersion by price. The 6 closings reporting DOM under 7 days were concentrated in the upper single-family range; the 4 closings over 60 days were spread across price points. Both extremes existed in the same quarter, indicating that marketing time depended on factors specific to individual properties rather than the segment as a whole.
For owners not transacting
The quarter's $193 million in total volume across 77 closings reflects a range of product that does not move uniformly. The condominium median of $540,000 and the single-family median of $2,700,000 are not points on a continuum—they represent distinct pools of buyers, locations, and property characteristics. The per-square-foot figures for in-town single-family homes consistently outpaced hillside estates on a rate basis, even when the hillside homes carried higher absolute prices. The quarter closed with its heaviest monthly volume in September (34 closings), ending a pattern of acceleration in transaction count from July through September.
Tim McMullen · CA DRE #02016832
[email protected] · (415) 691-9272
More from Los Gatos
202 Granada Way Closes at 123% of List as September Logs 34 Sales and a $2,165,000 Median
Thirty-four closings in Los Gatos last month produced $80.4 million in total volume, with single-family homes carrying a median of $2,475,000 while condominiums settled at $595,000—a spread that defines where the market is and is not moving.
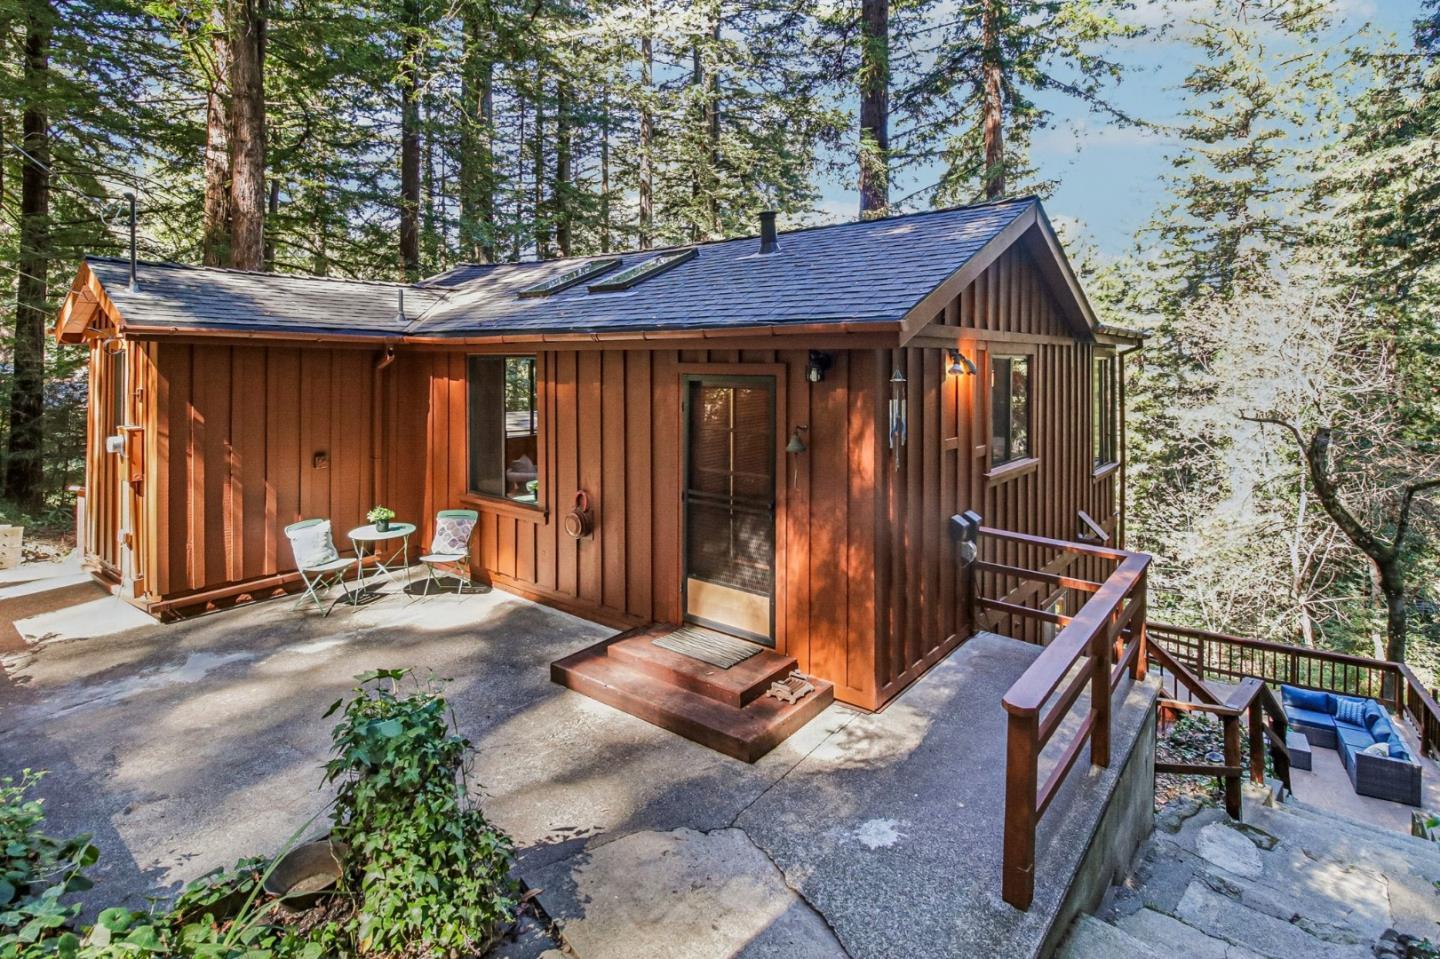
The Los Gatos House Listed at $599,000 While Its Only Rival Asks $895,000
Among nine comparable single-family sales in the area, the median price was $930,000 and one closed at $2.25 million. The Norman Drive listing is priced well below the cheapest of them.
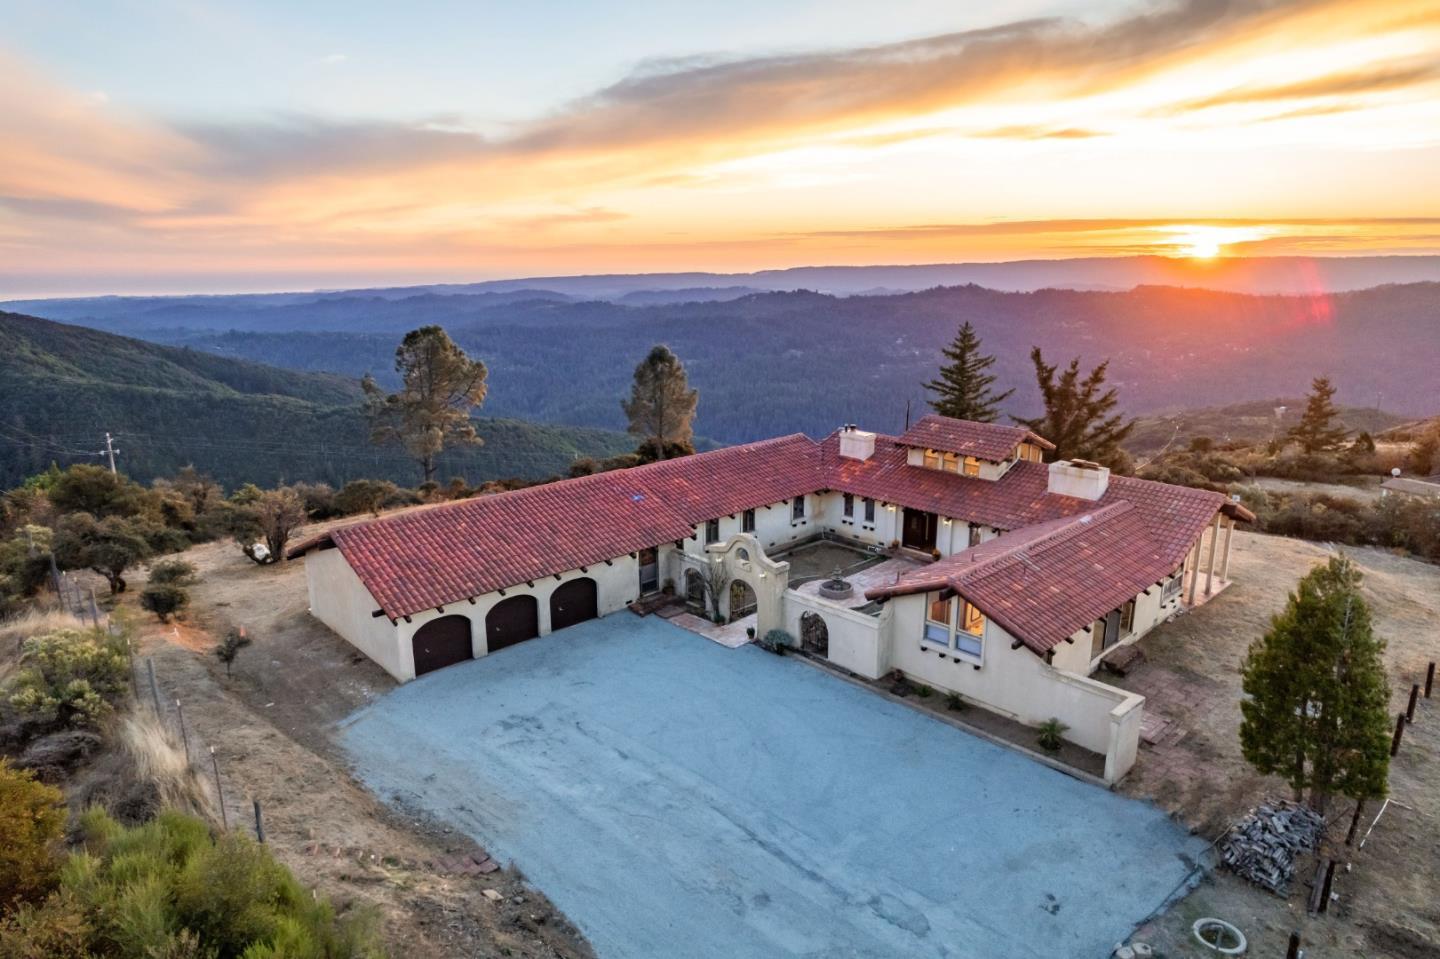
Mountain-top compound sells below asking price
A single-family home on Soda Springs Road recorded at $1,370,000 — $130,000 below its list price — while a $2.8M house and a $1.199M condo appeared on the MLS feed. Nothing went pending.