April 2026 in Los Gatos: A market split straight down the middle
# April 2026 in Los Gatos: A market split straight down the middle
Forty-eight closings. Twenty sales above list price, twenty below, and the rest landing exactly at ask. That kind of symmetry is rare, and it's the defining fact of April.
The numbers
| Metric | April 2026 |
|---|---|
| Closings | 48 |
| Median sale price | $2,153,500 |
| Median price per sq ft | $1,183 |
| Median days on market | 11 |
| Sale-to-list ratio (median) | 100% |
| Sales over list | 20 |
| Sales under list | 20 |
What sold
Single Family — 34 sales
The range ran from $296,820 to $8,000,000 — yes, that's the same market. The median landed at $2,600,000, with a median of 10 days on market and $1,338 per square foot. Most of April's action, and most of its drama, lived here.
Townhouse — 11 sales
Eleven townhomes closed between $1,025,000 and $2,157,000. The median was $1,675,000, $959 per square foot, and nine days on market — the fastest segment of the month. Eleven sales is a real sample; these figures hold up.
Condominium — 3 sales
Three condos closed, ranging from $625,000 to $1,910,000. Three is too few to report a median responsibly, so those are the numbers: a low, a high, and three transactions somewhere in between.
What moved the median
The mix didn't drive this month's median — the data doesn't support that reading. Single-family homes made up 71% of closings, which is squarely in line with what you'd expect in Los Gatos, and no material shift in segment composition is at work here. The $2,153,500 overall median reflects what homes actually sold for across 48 transactions, nothing more complicated than that.
The 100% median sale-to-list is worth sitting with for a moment. It doesn't mean every home sold at asking — twenty went over, twenty went under. It means the middle of the distribution landed exactly at list. Sellers who priced accurately found buyers at that price. Sellers who priced too high took cuts. Sellers who priced into demand left money on the table for the buyer. No single story, which is why the overall number is exactly 100.
Eleven days as the median time to contract is quick by any measure. It tells you that most of what came to market in April found a signed offer within two weeks. The ones that didn't — some of them show up in the "under list" column, some took longer, and at least one is worth a closer look below.
The one to notice
28860 Loma Chiquita Road closed at $296,820 against a list price of $225,000 — 31.9% over asking, the widest gap of the month by percentage. It was also the lowest-priced single-family close of April, which makes the number more striking, not less. A $71,820 overbid on a $225,000 list is a different animal than a percentage-point premium on a $3,000,000 home. What the property is, exactly, or what drove that outcome, isn't in the record. What's in the record is the number, and it stands out.
On the other end of the scale: 357 Pennsylvania Avenue closed at $8,000,000, 3,834 square feet, eight days on market. The top sale of the month, gone in a little over a week.
And for the deepest discount: 24595 Skyland Road listed at $2,500,000 and closed at $2,300,000, an 8% reduction — the largest cut recorded in April. A $200,000 gap between ask and close on a single transaction is a real number, and it's a reminder that the 100% median sale-to-list ratio is an aggregate, not a guarantee. Some sellers gave ground. That one gave the most.
Every recorded sale this month
All 48 closings, in order of price. Each address links to its full record.
| Address | Type | Bd/Ba | Sq ft | List | Sold | % of list | DOM | Closed |
|---|---|---|---|---|---|---|---|---|
| 357 Pennsylvania Avenue | Single Family | 4/4.5 | 3,834 | $8,000,000 | $8,000,000 | 100.0% | 8 | Apr 24 |
| 90 Reservoir Road | Single Family | 5/6.5 | 5,050 | $6,900,000 | $6,800,000 | 98.6% | 8 | Apr 14 |
| 16781 Littlefield Lane | Single Family | 6/6 | 5,701 | $6,450,000 | $6,775,000 | 105.0% | 9 | Apr 21 |
| 117 Edelen Avenue | Single Family | 5/4.5 | 3,298 | $4,500,000 | $4,500,000 | 100.0% | 9 | Apr 30 |
| 16508 Oleander Avenue | Single Family | 5/3 | 3,102 | $4,199,000 | $4,300,000 | 102.4% | 9 | Apr 2 |
| 21 Euclid Avenue | Single Family | 4/2.5 | 2,670 | $3,850,000 | $4,300,000 | 111.7% | 7 | Apr 2 |
| 210 Vista Del Monte | Single Family | 4/3.5 | 3,265 | $4,128,000 | $4,200,000 | 101.7% | 17 | Apr 1 |
| 17246 Verdes Robles | Single Family | 4/2.5 | 2,423 | $4,088,000 | $4,000,000 | 97.8% | 34 | Apr 21 |
| 45 Central Avenue | Single Family | 4/3 | 2,474 | $3,798,000 | $3,950,000 | 104.0% | 9 | Apr 1 |
| 15931 Camino Del Cerro | Single Family | 4/2.5 | 2,846 | $3,699,950 | $3,750,000 | 101.4% | 14 | Apr 14 |
| 133 Boyer Lane | Single Family | 4/3.5 | 2,653 | $3,749,000 | $3,749,000 | 100.0% | 6 | Apr 13 |
| 116 Brocastle Way | Single Family | 4/3 | 2,403 | $3,298,000 | $3,650,000 | 110.7% | 5 | Apr 16 |
| 19544 Sky Oaks Way | Single Family | 4/3 | 2,725 | $3,625,000 | $3,625,000 | 100.0% | 0 | Apr 27 |
| 46 Pleasant Street | Single Family | 4/2.5 | 1,800 | $3,480,000 | $3,300,000 | 94.8% | 11 | Apr 28 |
| 1451 Elwood Drive | Single Family | 5/2.5 | 2,212 | $2,788,000 | $3,161,000 | 113.4% | 7 | Apr 15 |
| 15758 Longwood Drive | Single Family | 4/3.5 | 2,194 | $2,779,000 | $2,651,000 | 95.4% | 9 | Apr 15 |
| 22108 Call Of The Wild Road | Single Family | 6/5 | 3,773 | $2,650,000 | $2,650,000 | 100.0% | 5 | Apr 14 |
| 23435 Summit Road | Single Family | 5/3.5 | 4,262 | $2,680,000 | $2,550,000 | 95.1% | 218 | Apr 3 |
| 222 Nicholson Avenue | Single Family | 3/2 | 1,234 | $2,400,000 | $2,380,000 | 99.2% | 14 | Apr 17 |
| 85 Prospect Avenue | Single Family | 4/4 | 2,432 | $2,198,888 | $2,310,000 | 105.1% | 24 | Apr 13 |
| 24595 Skyland Road | Single Family | 4/3.5 | 3,403 | $2,500,000 | $2,300,000 | 92.0% | 136 | Apr 14 |
| 124 Hollycrest Drive | Single Family | 3/2 | 1,323 | $2,295,000 | $2,290,000 | 99.8% | 13 | Apr 15 |
| 15581 Flintridge Drive | Single Family | 3/2.5 | 2,106 | $2,198,000 | $2,198,000 | 100.0% | 69 | Apr 20 |
| 105 Altura Vista | Townhouse | 3/2.5 | 2,230 | $2,098,000 | $2,157,000 | 102.8% | 9 | Apr 29 |
| 219 Longridge Road | Single Family | 4/2 | 1,388 | $1,998,000 | $2,150,000 | 107.6% | 20 | Apr 24 |
| 145 Holly Hill Way | Single Family | 4/2 | 1,314 | $1,998,000 | $2,125,000 | 106.4% | 12 | Apr 8 |
| 162 Maggi Court | Townhouse | 3/2.5 | 1,650 | $1,950,000 | $2,100,000 | 107.7% | 4 | Apr 11 |
| 258 Howes Drive | Single Family | 3/2 | 1,440 | $2,195,000 | $2,100,000 | 95.7% | 26 | Apr 20 |
| 16447 Mcmillan Court | Condominium | 3/3.5 | 2,089 | $1,950,000 | $1,910,000 | 97.9% | 28 | Apr 1 |
| 359 Penn Way | Single Family | 3/2 | 1,332 | $1,978,800 | $1,900,000 | 96.0% | 6 | Apr 28 |
| 121 Rio Vista | Townhouse | 3/2.5 | 2,319 | $1,759,000 | $1,785,000 | 101.5% | 3 | Apr 23 |
| 115 El Porton | Townhouse | 3/2.5 | 1,630 | $1,799,000 | $1,775,000 | 98.7% | 3 | Apr 20 |
| 2 No Name Road | Single Family | 3/2.5 | 3,150 | $1,750,000 | $1,730,000 | 98.9% | 14 | Apr 10 |
| 132 Altura Vista | Townhouse | 2/2 | 1,443 | $1,700,000 | $1,700,000 | 100.0% | 0 | Apr 30 |
| 17775 Old Summit | Single Family | 6/3 | 3,232 | $1,749,000 | $1,679,000 | 96.0% | 7 | Apr 21 |
| 121 Calle Nivel | Townhouse | 4/2.5 | 1,747 | $1,700,000 | $1,675,000 | 98.5% | 15 | Apr 21 |
| 126 Via Lago | Townhouse | 3/2.5 | 1,848 | $1,598,000 | $1,660,000 | 103.9% | 44 | Apr 13 |
| 19118 Old Vineyard Road | Single Family | 3/2.5 | 1,923 | $1,589,000 | $1,600,000 | 100.7% | 22 | Apr 13 |
| 22575 Summit Road | Single Family | 3/2 | 1,504 | $1,699,000 | $1,600,000 | 94.2% | 22 | Apr 27 |
| 207 Palmer Drive | Townhouse | 3/2.5 | 1,943 | $1,598,000 | $1,580,000 | 98.9% | 183 | Apr 3 |
| 169 Escobar Avenue | Townhouse | 2/2 | 1,015 | $1,249,000 | $1,275,000 | 102.1% | 22 | Apr 10 |
| 435 Alberto Way #2 | Townhouse | 3/2.5 | 1,448 | $1,250,000 | $1,215,000 | 97.2% | 31 | Apr 29 |
| 16152 Loretta Lane | Townhouse | 2/2.5 | 1,334 | $990,000 | $1,025,000 | 103.5% | 5 | Apr 7 |
| 50 Ocean View Road | Single Family | 2/1.5 | 844 | $950,000 | $950,000 | 100.0% | 44 | Apr 17 |
| 600 Pennsylvania Avenue #14 | Condominium | 1/1.5 | 864 | $869,000 | $850,000 | 97.8% | 11 | Apr 7 |
| 449 Alberto Way #132 | Condominium | 2/2 | 888 | $659,900 | $625,000 | 94.7% | 44 | Apr 23 |
| 21565 Alma Court | Single Family | 3/1 | 1,248 | $300,000 | $355,000 | 118.3% | 8 | Apr 13 |
| 28860 Loma Chiquita Road | Single Family | 1/2 | 900 | $225,000 | $296,820 | 131.9% | 8 | Apr 1 |
Source: MLSListings closed sales in Los Gatos, April 2026. 48 closings. Sale prices and closing dates are matters of public record. A summary of recorded sales is not an appraisal and is not an opinion of value on any specific home.
Tim McMullen · DRE #02016832 · How these numbers are put together
More from Los Gatos
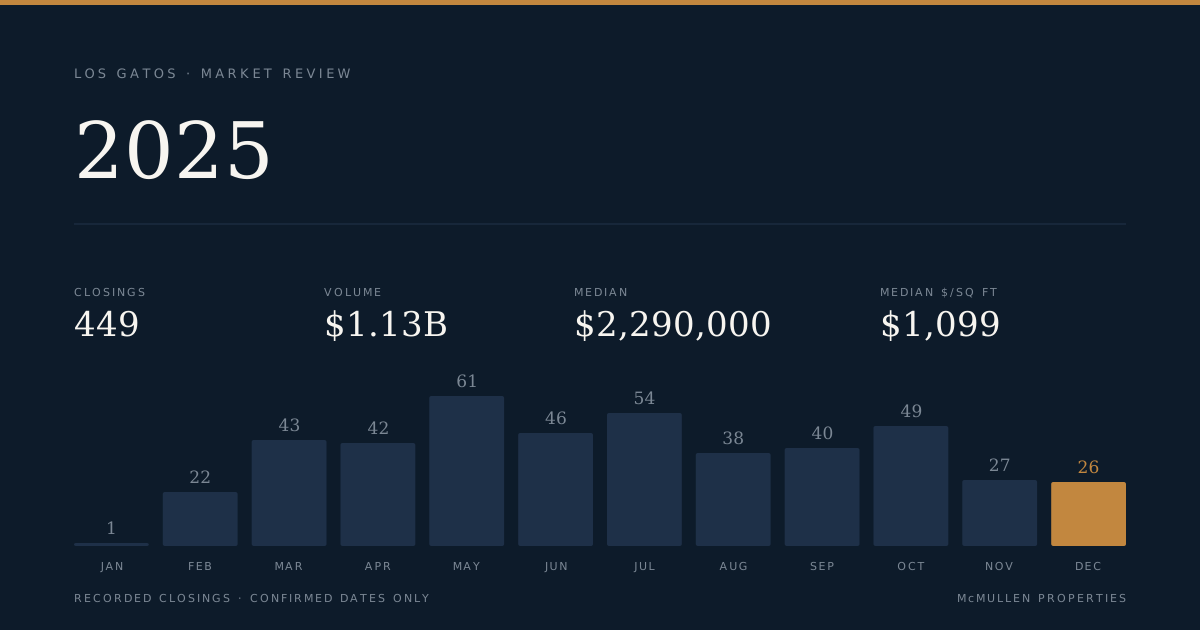
449 Closings, $1.13 Billion: Los Gatos 2025 by the Numbers
The full-year record covers 449 closed transactions across single-family, townhouse, and condominium segments, with a market-wide median of $2,290,000 and total volume of $1,129,374,552. The sharpest divide of the year ran not between segments but between price bands: the $2M–$3M band logged 101 closings while the top tier above $5M managed just 25, yet that upper tier posted the highest median price-per-square-foot of any band at $1,484.
343 acres sold in Los Gatos for $13 million — at $37,880 per acre
The sale of 25373 Spanish Ranch Road recorded as a land transaction, not a house sale. At 343.19 acres and $13 million, price per acre is the only unit that makes sense.
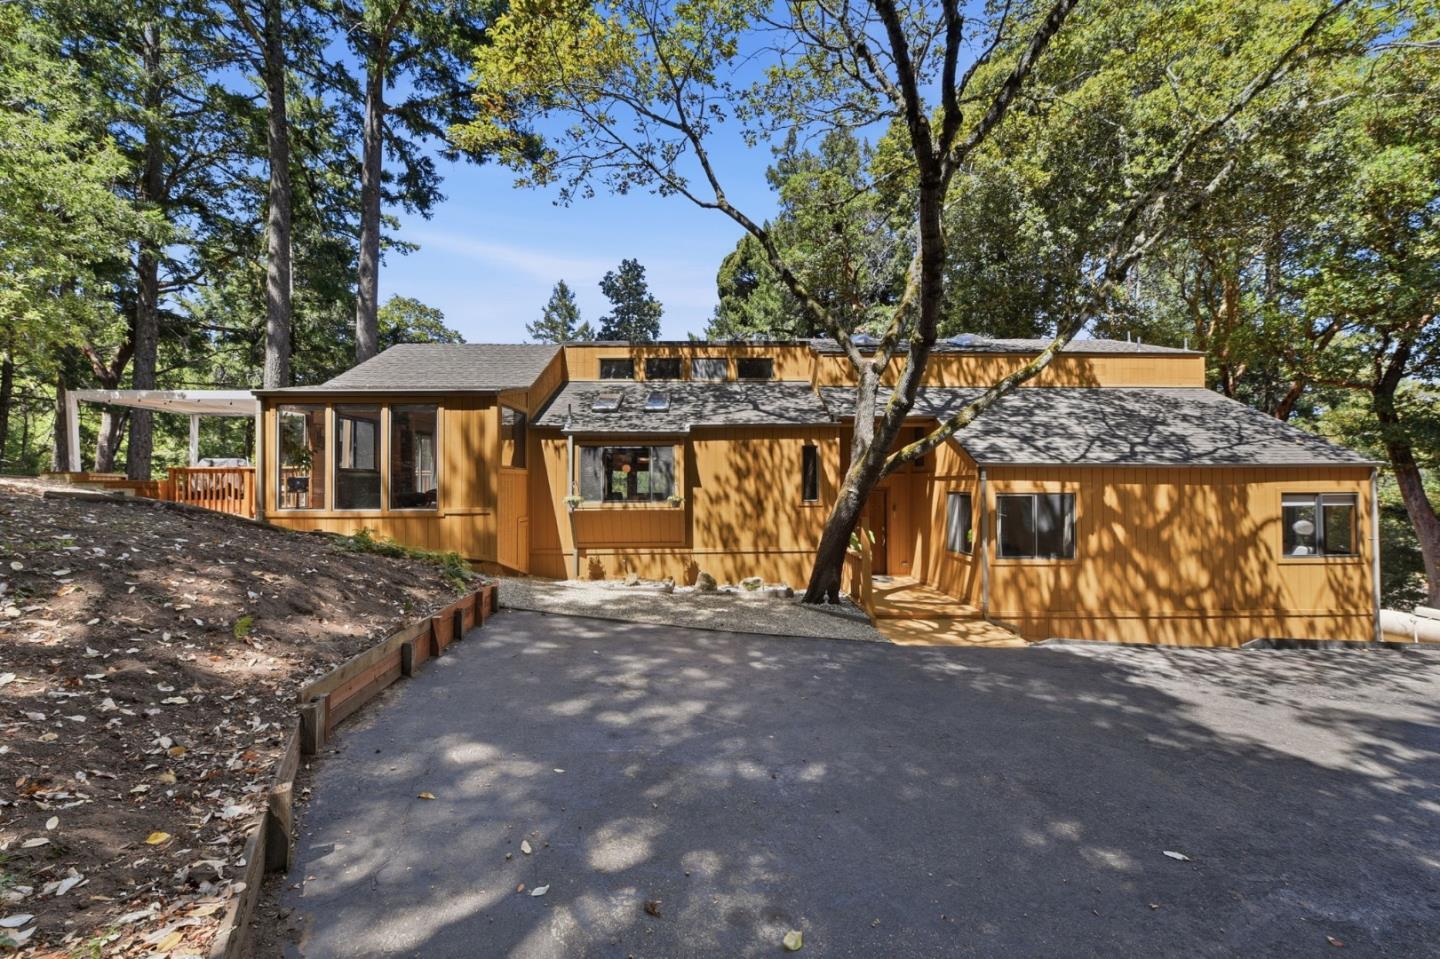
Back on the market 7 months after it last sold, at $98,000 more
22163 Miller Ridge Road recorded as sold in February 2026 for $1,400,000. It hit the active market again in August at $1,498,000 — a $98,000 spread in under seven months.